

Key takeaways
- Total Views counts how many times viewers open your video page (a page view, not a video view), while Total Plays counts clicks to play the video.
- Total Clicks measures clicks on the call-to-action button below your video, and Total Likes counts likes on the like button. You can turn the like button on or off for your whole workspace or for one video, in which case Total Likes stops accruing.
- Watch time shows a video heatmap of which part of your video each viewer played, plus the percentage watched per session.
- Your own views are excluded from analytics as long as you play the video inside your account.
How do you open the video analytics modal?
From either My Library or Team Library, click on the analytics icon on your video to launch the video analytics modal.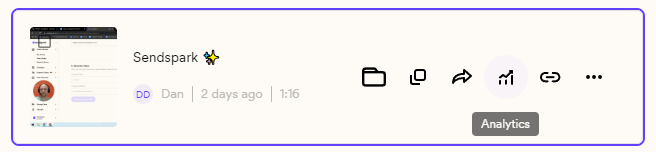
How to Read Sendspark Video Analytics
On the video analytics modal, you’ll see several categories. Here’s what they all mean: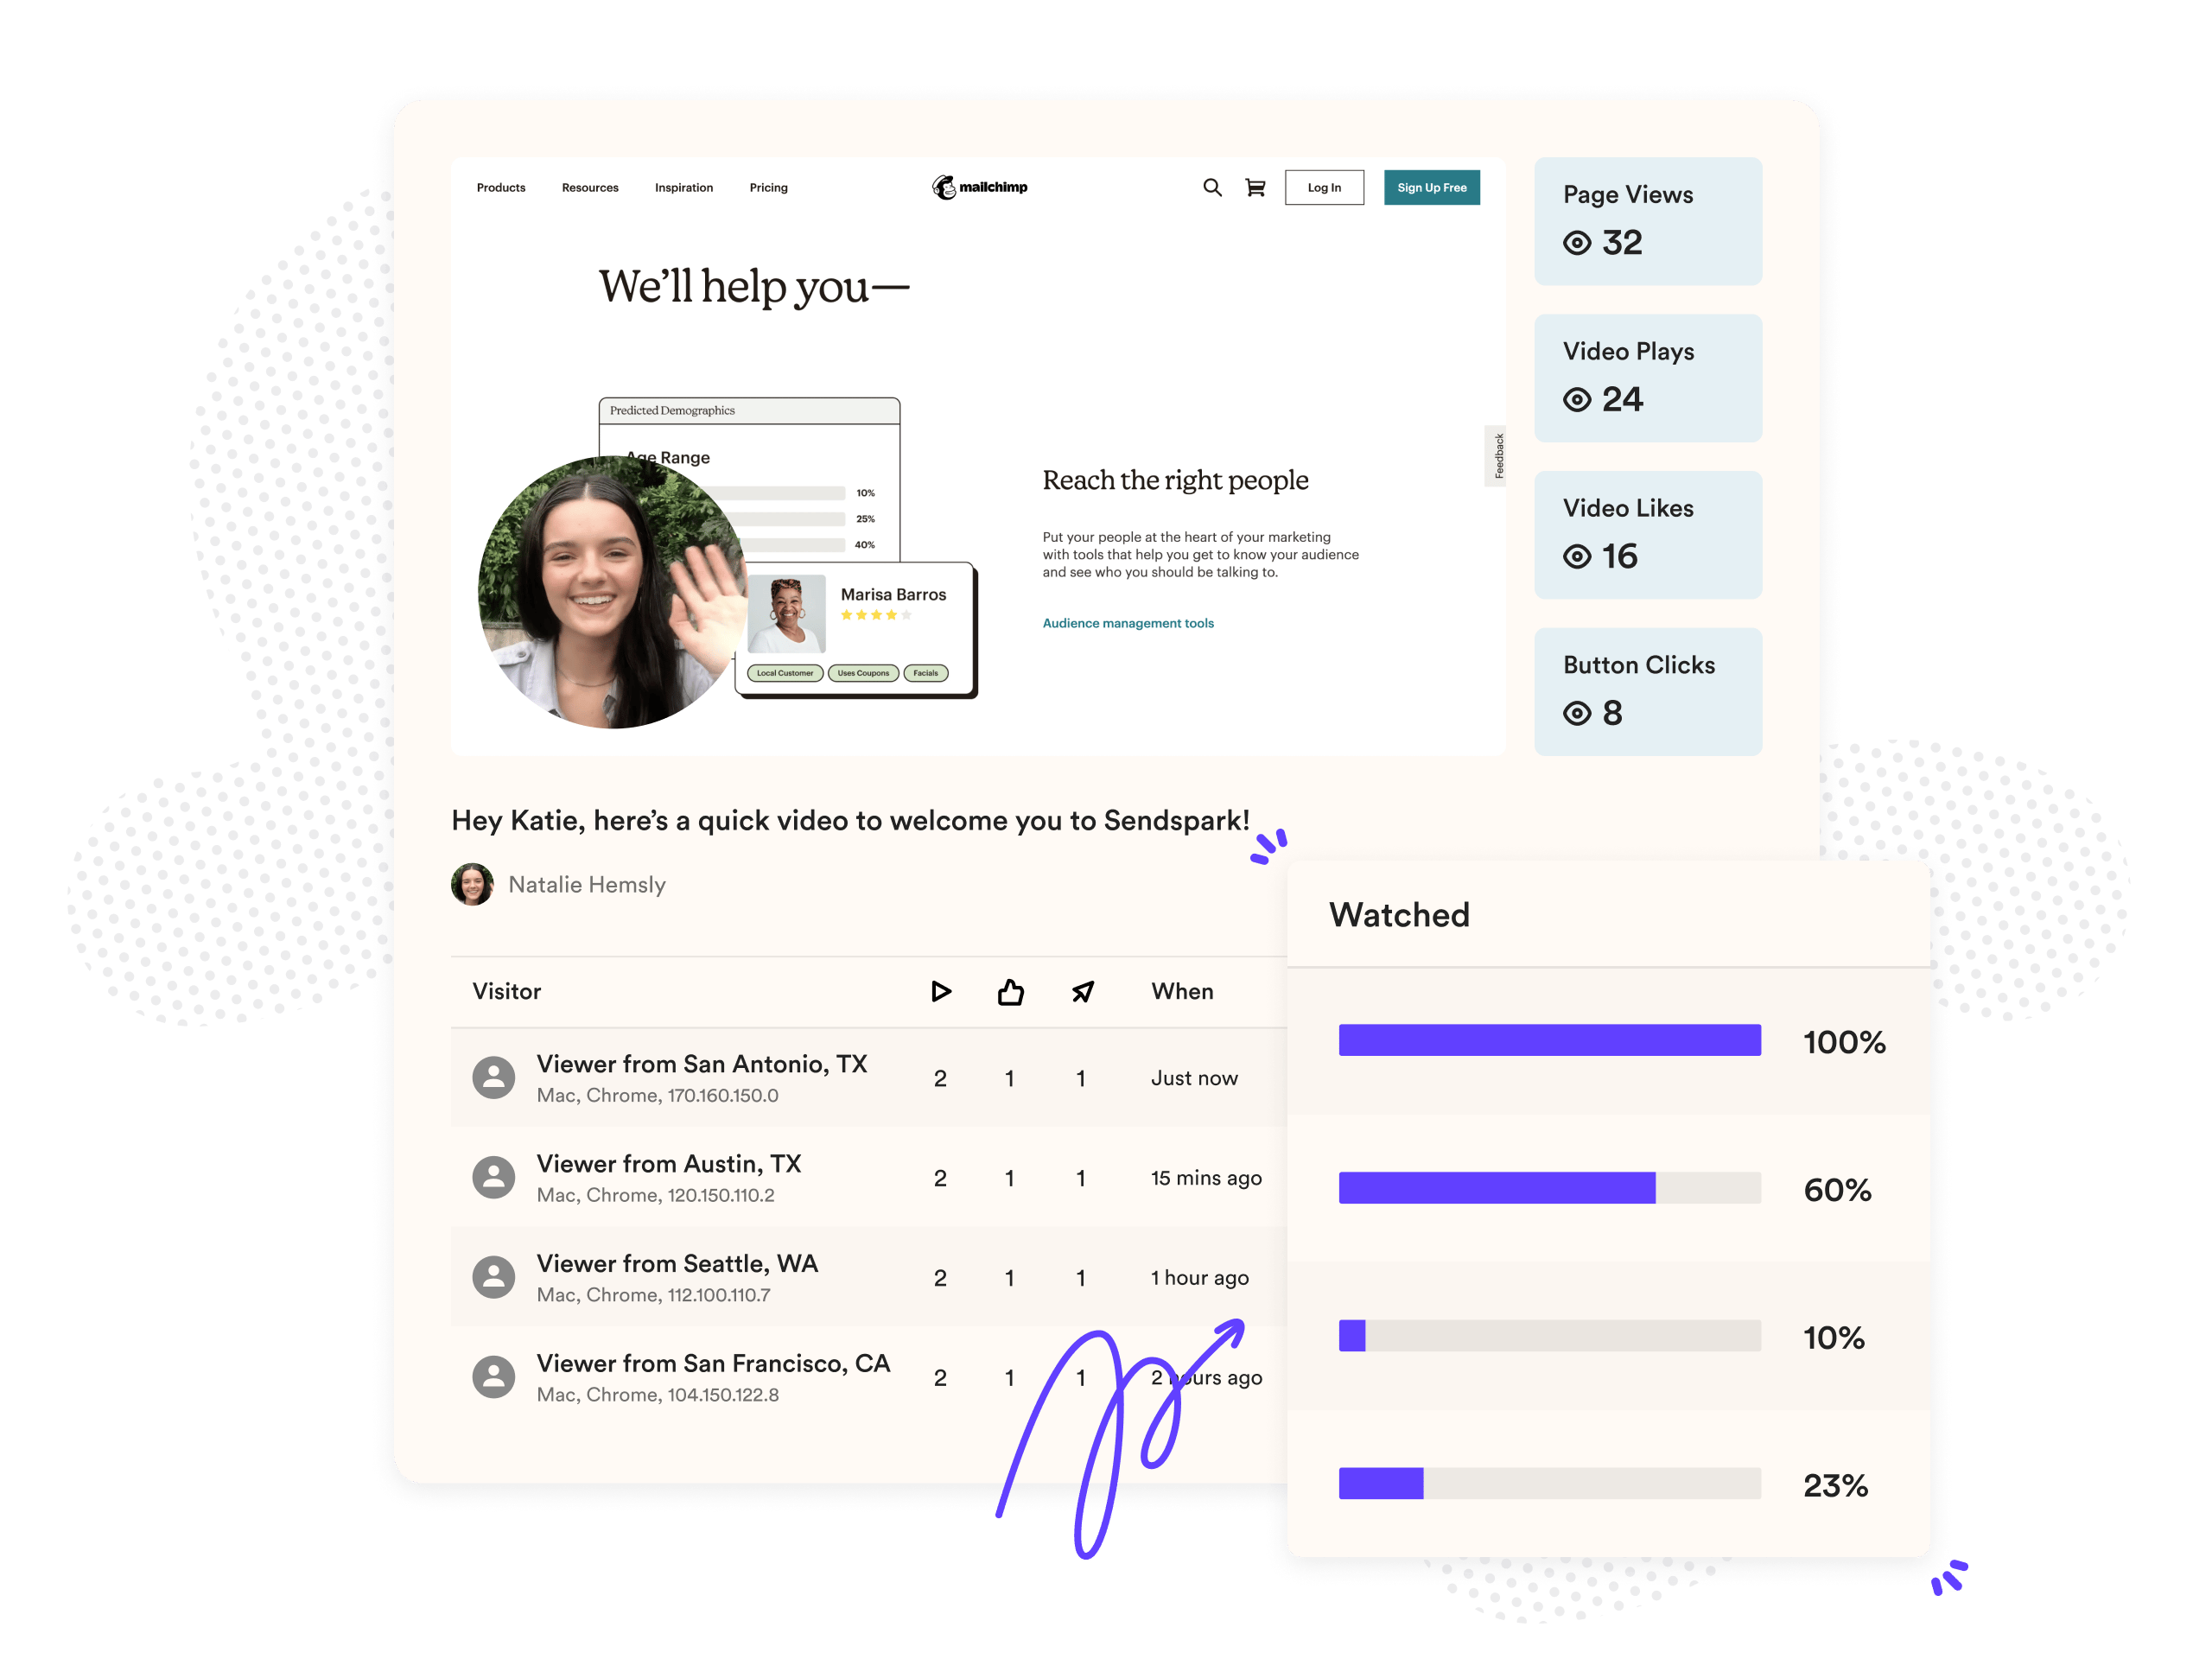
Page Views:
The number of times viewers open your video page. This is a page view, NOT a video view.Video Plays:
The number of times viewers click to play your video. Note that if someone starts and stops your video multiple times, it will count as multiple plays.Button Clicks:
The number of clicks on the call-to-action button below your video.Video Likes:
The number of times viewers hit the like button on the bottom right of your video. Note that one viewer can like the video multiple times.Viewer Insights & Watch Time
At the bottom of the video modal, you’ll also see a breakdown of views, plays, clicks, likes, and watch timeseparated by individual. The views, plays, clicks, and likes correspond to the data above. Watch time displays a video heatmap showing which part of your video each viewer actually played. Next toWatch Time, you’ll see the percentage watchedby the viewer during that session.Frequently asked questions
What's the difference between Total Views and Total Plays?
What's the difference between Total Views and Total Plays?
Total Views is the number of times viewers open your video page (a page view, not a video view), while Total Plays is the number of times viewers click to play your video. Starting and stopping the video multiple times counts as multiple plays.
What does Total Clicks measure?
What does Total Clicks measure?
Total Clicks is the number of clicks on the call-to-action button below your video.
What does watch time show?
What does watch time show?
Watch time displays a video heatmap showing which part of your video each viewer actually played, and next to it you’ll see the percentage watched by that viewer during the session.
Are my own views counted in analytics?
Are my own views counted in analytics?
No. Your visits are excluded from video analytics as long as you play the video inside your account. If you open the share link in a new tab and play it, that will count your views. Sendspark excludes creator views using mechanisms like cookies, IP addresses, and account associations.
Where do I open video analytics?
Where do I open video analytics?
From either My Library or Team Library, click the analytics icon on your video to launch the video analytics modal.
Can I connect my CRM to identify viewers?
Can I connect my CRM to identify viewers?
Yes. You can connect CRM, Instant, and Email Platform integrations from your integrations settings, and search the help center for setup details on a specific integration.
How can I test if my analytics are working correctly?
How can I test if my analytics are working correctly?
Play your video in a way that isn’t tied to your account: use incognito or private browsing mode, open the share link on a separate device like a phone, or send the link to someone else (or a secondary email). Each logs a genuine view so you can confirm interactions are tracked.
Can I see video engagement data from before January 19th, 2022?
Can I see video engagement data from before January 19th, 2022?
No. Video engagement data recorded before January 19th, 2022 (when analytics launched) isn’t available in the app. If you message us, we can look up total views, plays, likes, and clicks for an individual video, but not viewer insight data.