

Key takeaways
- Open the Analytics modal from the Analytics button on any video in your video dashboard.
- Total Views counts page opens, not plays. Total Plays counts actual video plays, Total Clicks counts call-to-action clicks, and Total Likes counts thumbs-up clicks. If these numbers don’t line up with your sending tool, video analytics vs email open rates explains why the two are measured differently.
- Viewer Insights shows each session’s visitor location, device, browser, and IP, plus per-session play, click, and like counts, the share of the video they watched, and the time of their last interaction.
- Total Engagement data goes back to when you created your account; Viewer Insights data starts January 14, 2022.

Total Engagement Metrics
- **Total Views —**The number of page views your video has. This does not mean that your recipient/s played your video, just that they opened your video page.
- **Total Plays —**The number of times your video was played
- **Total Clicks —**The number of times your call-to-action button was clicked
- **Total Likes —**The number of times the “thumbs up” button on your video was clicked
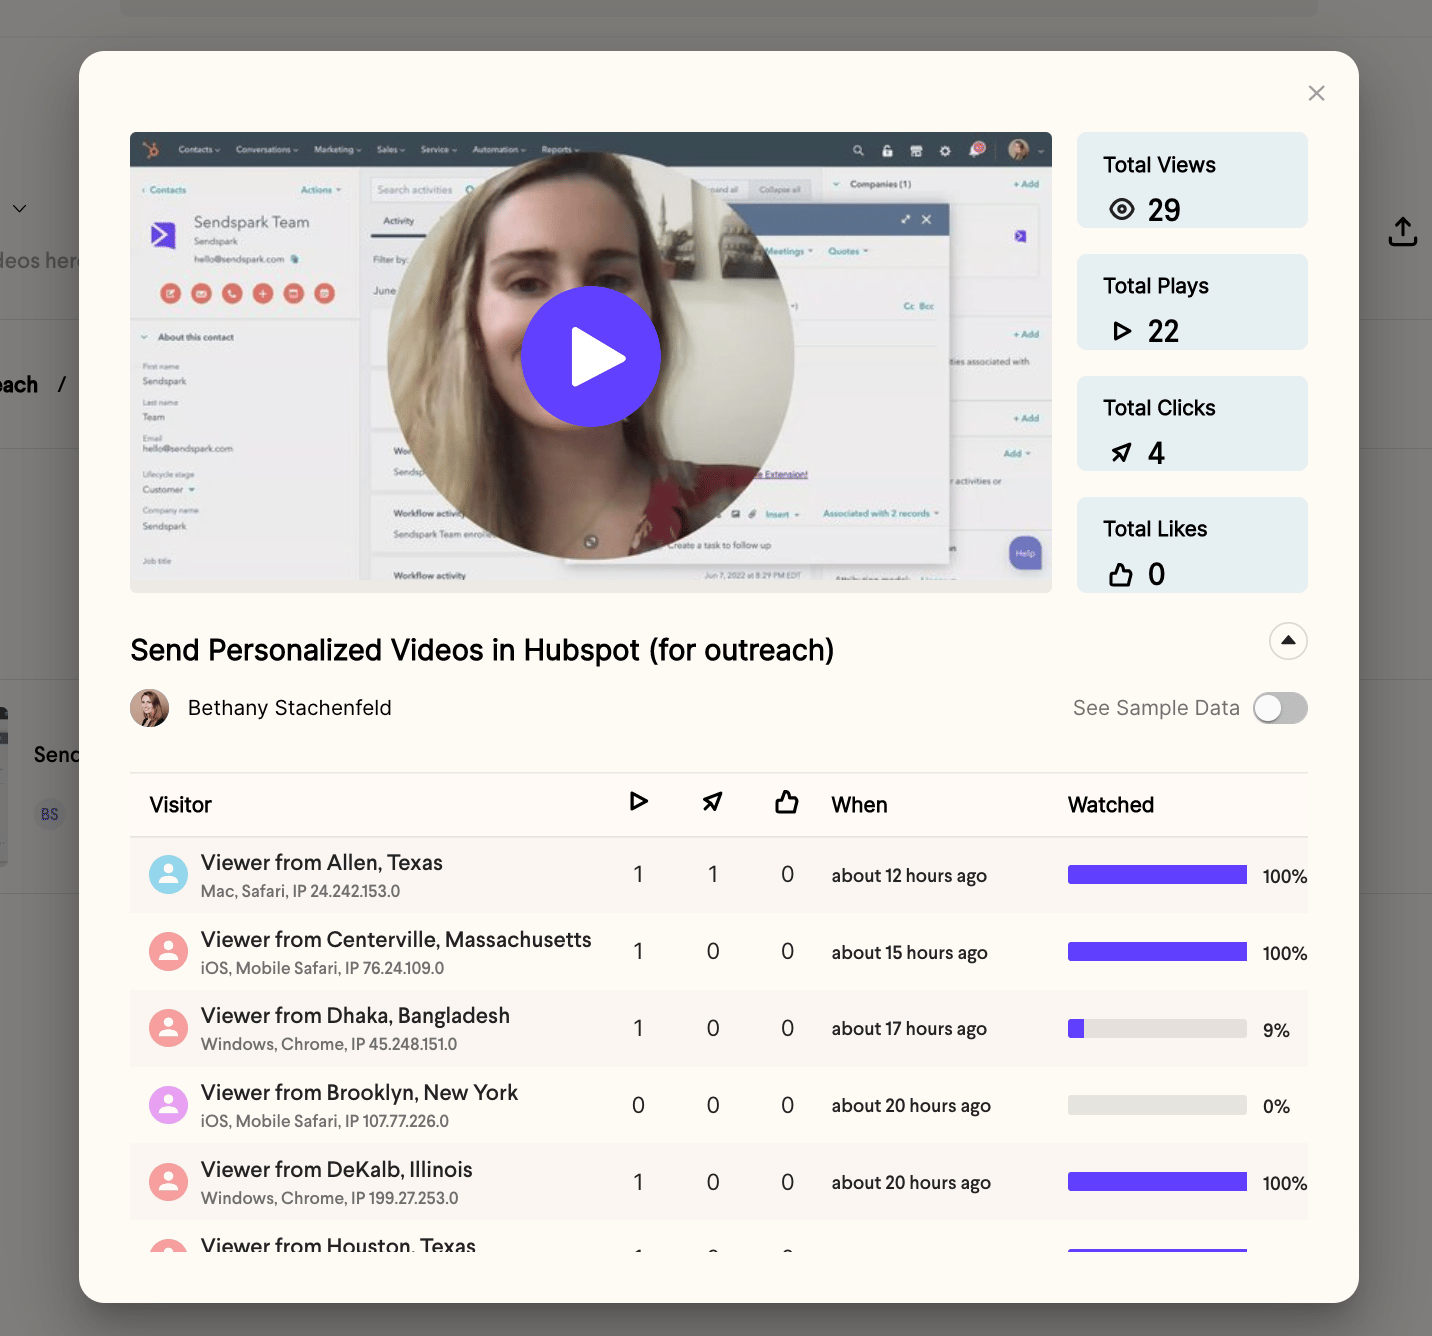
Viewer Insights
- **Visitor —**Who is opening your page. We’ll show their location, device, browser, and IP information to help you figure out who they are. Each line item represents a page session.
- Play Icon — How many times the visitor played your video in that session.
- **Click Icon —**How many times the visitor clicked your call-to-action button during their session.
- **Like Icon —**How many times the visitor liked the video during their session.
- **% Watched —**How much of the video that visitor got through in the session. Sessions from before 2 February 2022 are blank, because the data wasn’t captured yet. See percentage watched.
- **When —**The time the viewer performed their last interaction of the session (last play, thumbs up, etc.).
Frequently asked questions
Do my own views count in analytics?
Do my own views count in analytics?
Sendspark does its best to scrub your own views from analytics, but if you’re not logged into Sendspark your views might still appear. Check your IP address so you can identify yourself if you end up there. If you’re logged in, previews aren’t counted, and a banner confirms the view won’t be recorded.
What's the difference between Total Views and Total Plays?
What's the difference between Total Views and Total Plays?
Total Views is the number of times your video page was opened, which does not mean the recipient played the video. Total Plays is the number of times the video was actually played.
How far back does analytics data go?
How far back does analytics data go?
Total Engagement data is available from the moment you created your Sendspark account. Viewer Insights data starts on January 14, 2022, when that feature was released.
What is sample data?
What is sample data?
You can toggle on sample data to preview what analytics would look like with engagement. It’s fake data, provided only to help you understand how the feature works.
Where can I see team-wide analytics?
Where can I see team-wide analytics?
Open Team Insights from the left sidebar. It’s the workspace-wide dashboard, covering top performers, a member leaderboard, your top videos, and saved reports you can export to PDF. It’s in beta, and while it is, it takes the place of Team Overview in the sidebar. Your Admin Dashboard also gives higher-level insight into team usage.